
Overview
I have played an online rhythm game called osu! quite a long time at this point (I first registered my account in 2014!). Througout the years, I have witnessed much debate on a fair metric to rank map difficuty by- a problem I wish to contribute with this project.
The gameplay of osu! consists of a series of consecutive “hitcircles” appearing, typically mapped by a “mapper” in sync to a backing track, on a 512 tall by 384 “game-pixel” wide playfield, where the pixel size of a game pixel is adjusted accordingly to a user’s display resolution. A moment before an intended hit on a hitcircle, an outer “approach circle” appears and converges, then subsequently overlaps with the border of the hitcircle, at which time a player is intended to move their cursor over the hitcircle, and “tap” with an input, typically a computer keyboard or mouse click.
Mappers have creative freedom to put objects in various patterns to best represent a back- ing track. Naturally, some patterns are more difficult than others, with some significant considerations being object spacing, the map’s beats per minute (BPM), and the shape of the surrounding hitcircles. A common style of pattern referenced in this study is called a “jump”— a series of consecutive, highly spaced hitcircles which require a high degree of aiming dexterity.
In this study I identified a few possible parameters on hit error. First would be a player ranking metric created by the developers- performance points. We will assume that this metric generally correlates with player skill. I also consider a combination of the distance between successive hit objects, as well as the time delta between them, and parametrize them together as an "aim speed" measure.
I modified my tablet optimization application to export data of various selected replays from various players, additionally keeping track of each player's ID and the map ID to keep track of any problematic data points.
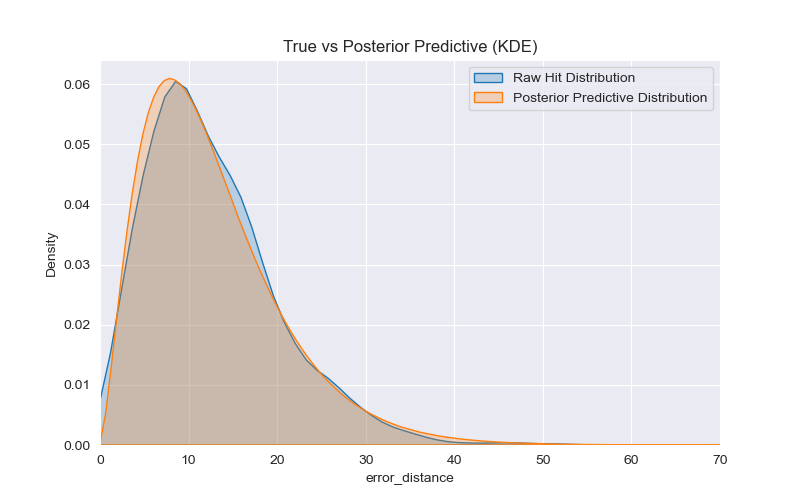
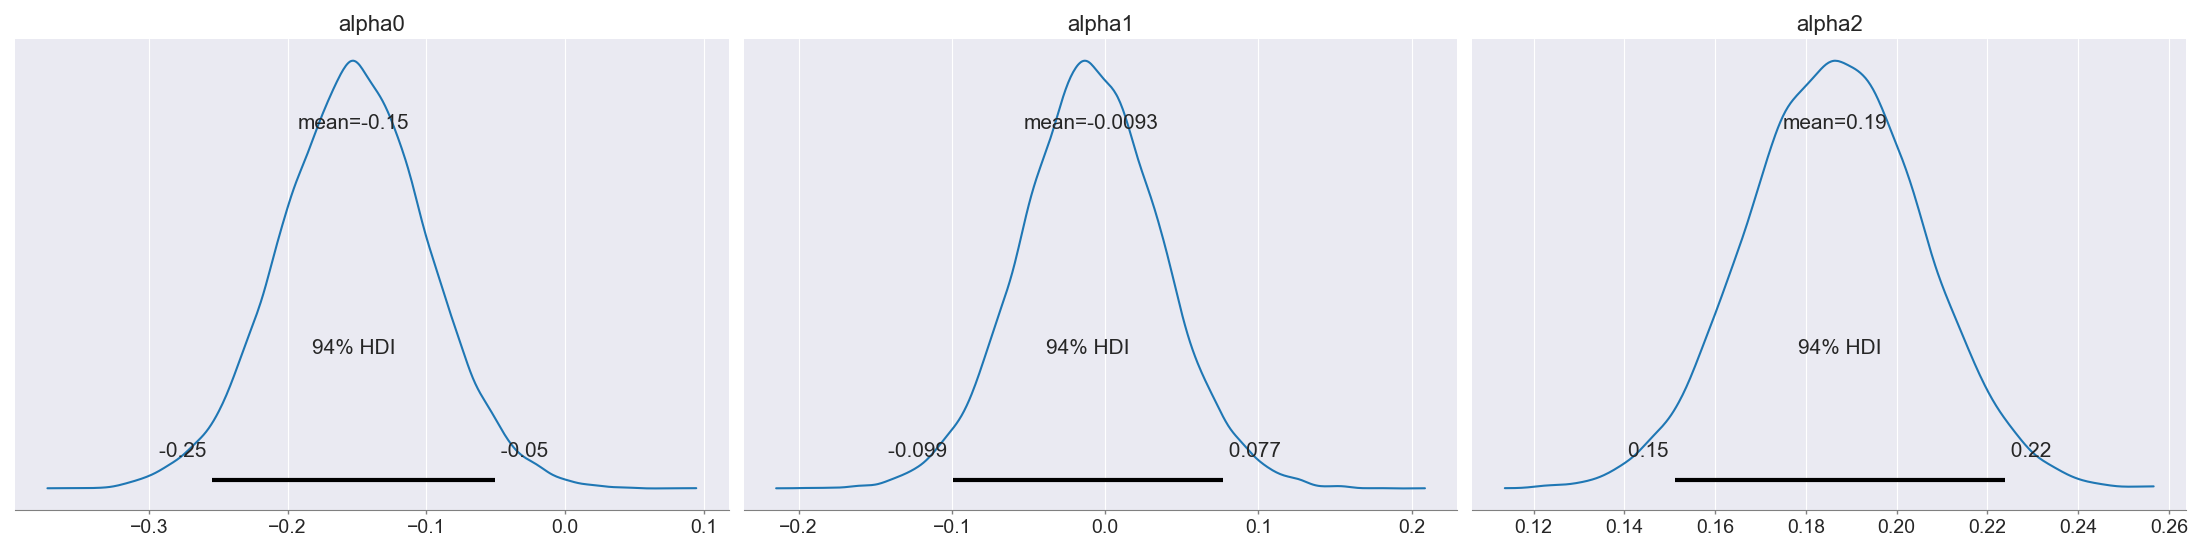
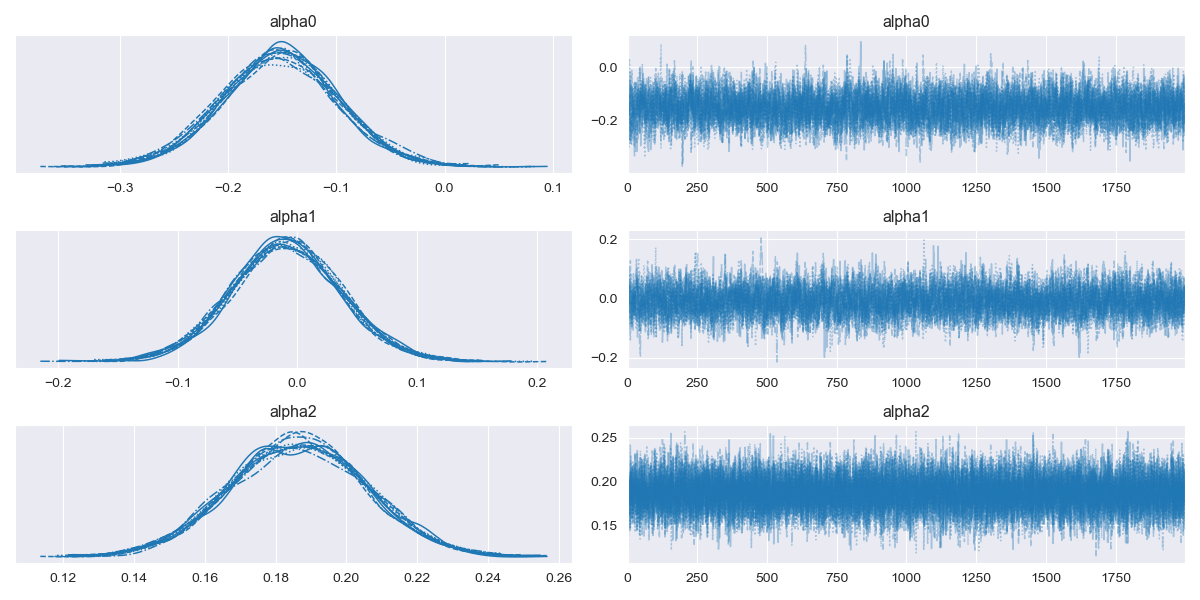
With these two parameters, as well as a player specific intercept term, I constructed a bayesian hierarchical model assuming a gamma-distributed prior (see reference 1), and used Markov Chain Monte Carlo (MCMC) to sample and produce predictive posterior distributions, which you can see some figures of on the left. For more information on the model, please read the full writeup.
Technologies/Keywords
Python (numpy, pandas), Bayesian Statistics, Markov Chain Monte Carlo (MCMC) techniques, Analytical Modeling.
References
Benjamin Thirey, Randal Hickman. Distribution of euclidean distances between randomly distributed gaussian points in n-space. https://arxiv.org/abs/1508.02238.